Today
WAVES POSSIBLE
3.2 m / 10 ftOffshore swell
- Period
- 8s
- Direction
- WNW
- Wind
- 11.8km/h
Partial coverage
PRAIA DO NORTE · NAZARÉ
Deus ao mar o perigo e o abismo deu,
Mas nele é que espelhou o céu.— Fernando PessoaWAVE OUTLOOK
2.8 m / 9 ft
Offshore swellObserved3.5 m11.5 ft
Modelled2.31 m7.6 ft
FORECAST NOW
Independent offshore sources
ObservedLast available 1.0 m3.3 ft
Observed3.5 m11.5 ft
Modelled2.31 m7.6 ft
Significant wave height (Hs), offshore — not breaking wave face height.
FLAT, WAVES POSSIBLE and BIG WAVES map the current validated offshore signal. GIANT WAVES and EXTREME remain reserved until a future validated source can justify them. Limited or unavailable data never activates a wave state.
The next significant swell changes for Praia do Norte.
WAVES POSSIBLE
3.2 m / 10 ftOffshore swell
Partial coverage
FLAT
2.4 m / 8 ftOffshore swell
WAVES POSSIBLE
2.6 m / 9 ftOffshore swell
WAVES POSSIBLE
2.8 m / 9 ftOffshore swell
Strongest swell in the current forecast.
Offshore readings only — never an estimate of wave height at the beach.
What is actually happening at Praia do Norte.
A webcam view, not a measurement — never used to confirm a wave height.
OFFSHORE ARCHIVE
Top 5 qualifying hourly readings
MONICAN buoys measure waves several kilometres offshore. At that point the swell already exists, but it can change significantly as it approaches Nazaré because of seabed shape, shoaling and the Nazaré Canyon. Offshore HMAX therefore does not directly represent the height of a breaking or surfed wave at Praia do Norte.
MONICAN values below are observations. Copernicus values are model estimates matched to the same UTC hour and buoy location. Only comparisons differing by 50% or less are included. This is a comparison filter, not a guarantee of model accuracy.
| Rank | MONICAN buoy | UTC hour | MONICAN observed HMAX | Copernicus modelled HMAX | Difference |
|---|---|---|---|---|---|
| 01 | MONICAN 1 | 17.1 m56.1 ft | 11.9 m39.0 ft | 43.7% | |
| 02 | MONICAN 2 | 17.0 m55.8 ft | 14.2 m46.6 ft | 19.6% | |
| 03 | MONICAN 1 | 16.4 m53.8 ft | 15.2 m49.7 ft | 8.3% | |
| 04 | MONICAN 1 | 15.7 m51.5 ft | 15.3 m50.1 ft | 2.8% | |
| 05 | MONICAN 1 | 15.5 m50.9 ft | 13.0 m42.7 ft | 19.1% |
FOLLOW THE SWELL
Offshore swell height · metres
3.18 m8.2 sWNW11.8 km/h wind
The season
Historically, November to February is the peak big-wave season, with October and March as shoulder months when North Atlantic storms can still align with the canyon.
See full season guide →Historical seasonality indicates when large Atlantic swells are more common. It does not guarantee a big-wave event.
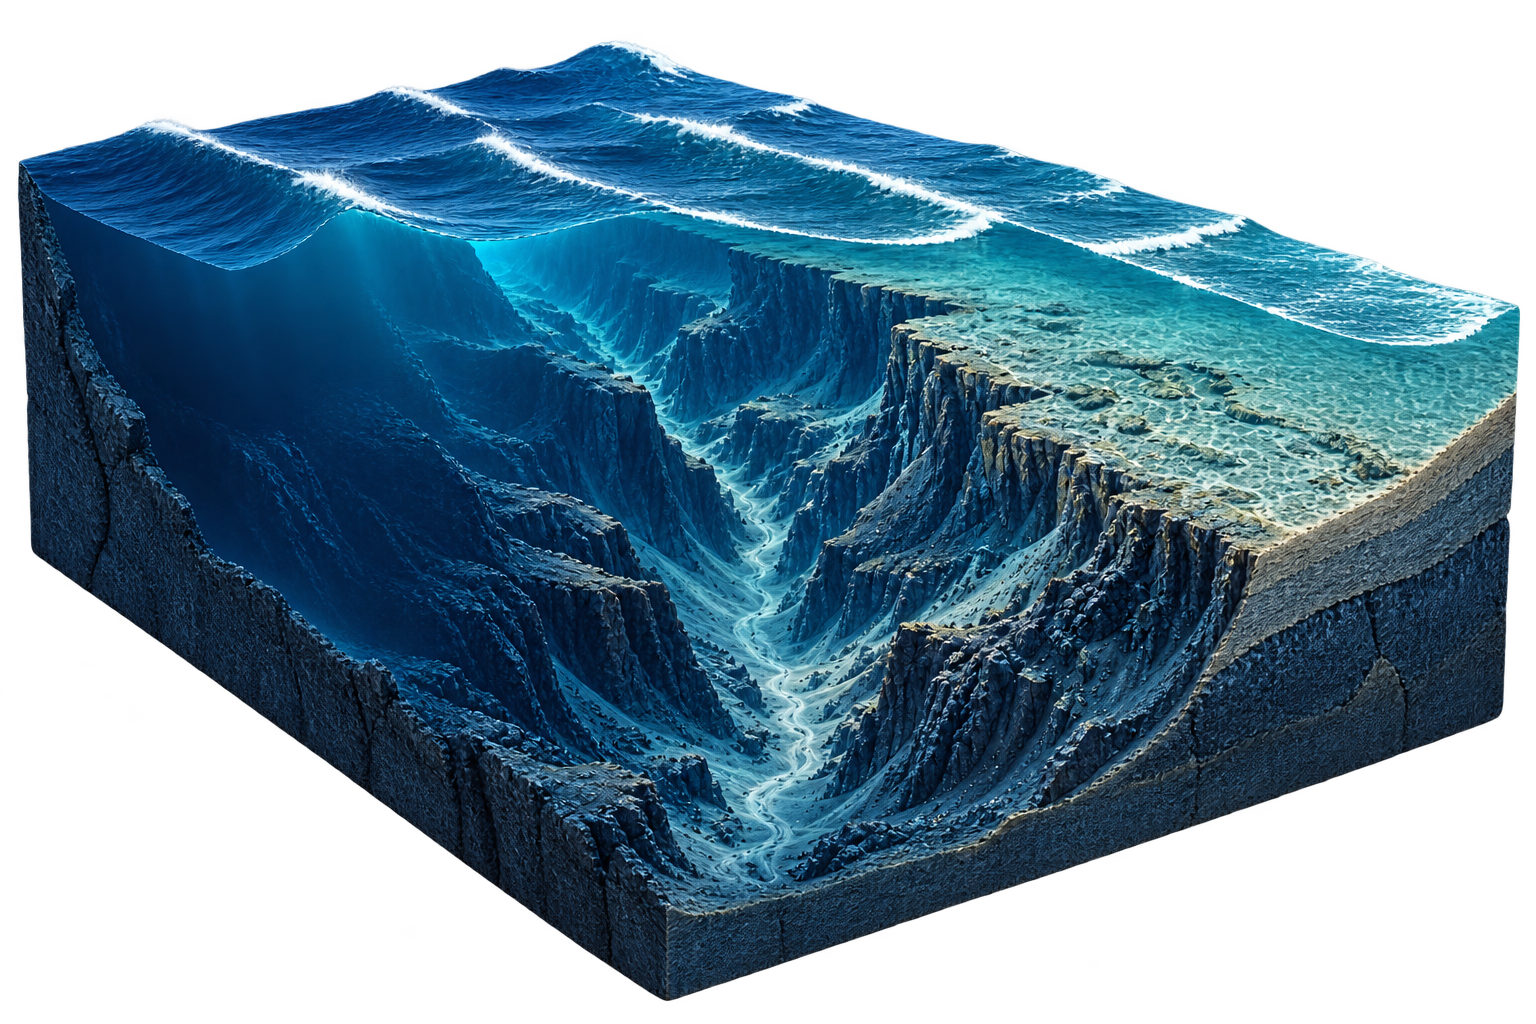
WHY NAZARÉ IS DIFFERENT
The canyon and the surrounding seabed help shape how Atlantic swell reaches this coast.
Understand the phenomenon ↗Conceptual illustration · not surveyed bathymetryHow we read the Atlantic
We bring together swell height, period, direction, wind and ocean-model context to make Nazaré easier to read.
No hype. No invented wave heights. Just the signals the Atlantic is actually giving us.
Forecast models and ocean data. No fictional conditions to make the day look bigger.
No banners. No sponsored forecast. The Atlantic gets enough attention already.
We don't sell your personal data. Optional analytics only run with your consent.
Built on Portugal's Silver Coast. Made for people who would rather know than guess.
Read the full forecasting method →
Adamastor preserves each forecast run and studies how Atlantic conditions evolve.
Data protection — Automated or systematic data extraction is monitored, logged and correlated for abuse detection. Public values are provided for human informational use only.
Analytics preferences
Oeste Surf uses optional analytics to understand which destinations and surf guides are useful. Analytics remain disabled until you accept.